- Services
Services
Inoviem provides a full range of services from drug discovery to clinical development by leveraging its platforms and direct access to human pathological specimens.
All the platforms and services are label-free with no modification of the original molecules.Unravel disease relevant Mode of Action (MoA) of your molecule directly on human tissues.
Identify and validate targets in your study model or in Human.
Thanks to our ex-vivo pharmacology expertise we identify the best disease and patients subgroups.
Using patients’ samples and PIMS® technology, we identify those individuals who can benefit best from your compound as soon as the early stage of preclinical studies.
Compounds of interest can be profiled for their drugability based on their mode of action and efficacy.
Translational pharmacology empowers your ability to identify biomarkers and advance clinical developments.
Advanced SPR and proteomics drive precise analysis of biomolecular interactions and protein landscapes.
Meticulous collection and biobanking of human samples fuel robust, translational research.
- Platforms
Platforms
Inoviem provides breakthrough protein technologies for each phase of the drug development process.
One of the major advantages of our label-free technologies used under physiological conditions and in human tissue – NPOT® and PIMS® – is that the test compound retains its original structure, as well as the exact same molecular structure that would be used in therapyPIMS®
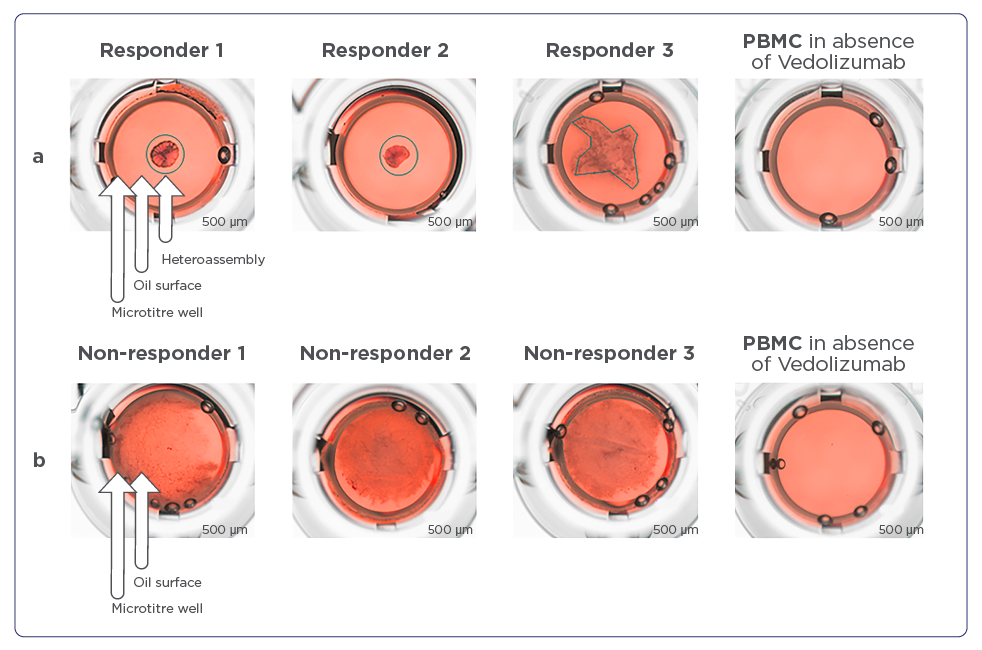
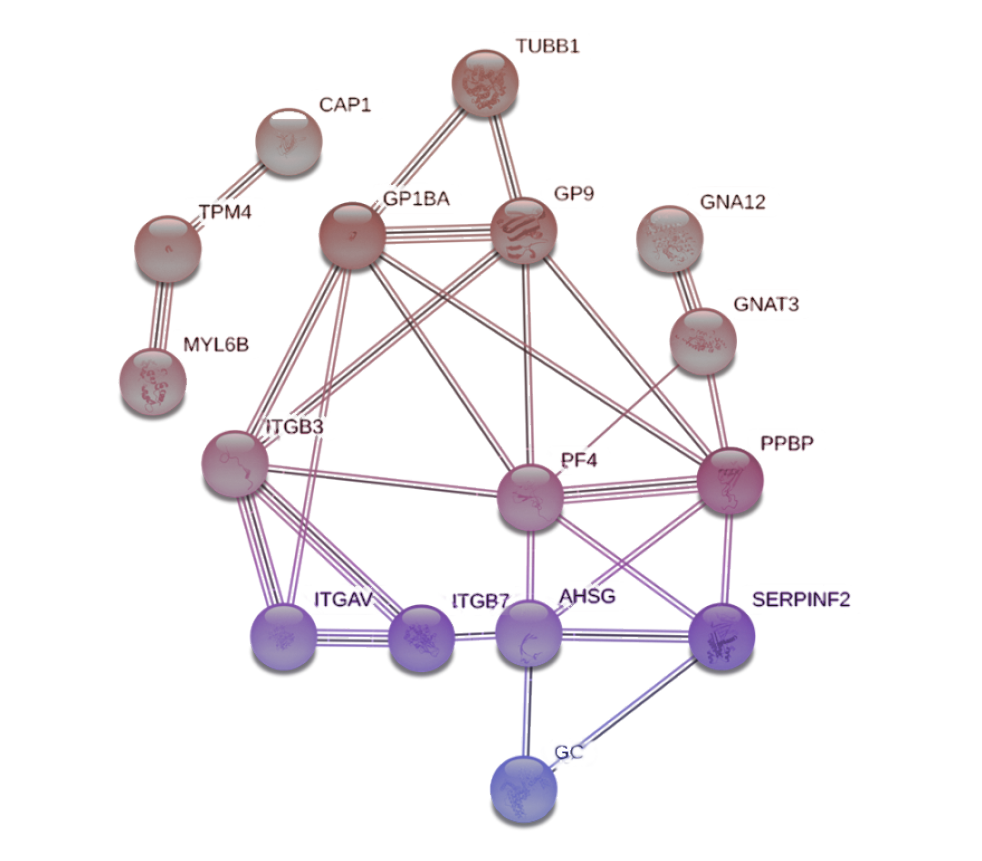
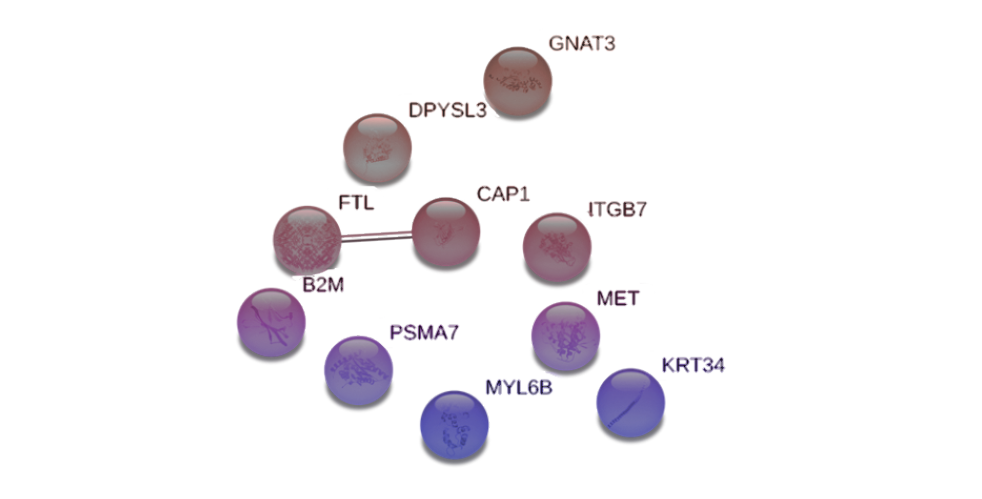
Designed to study molecular interactions and predict therapeutic responses in biomedical research
Biomarkers discovery
Methodology for the proteomic profiling of human individuals in the context of translational evaluation of biomarkers and clinical development of new drug candidates.
- Knowledge centre
- About us
About us
Inoviem Scientific is a Bioanalytical R&D company established in 2011 in Strasburg – France.

Our mission
Our mission is clear: to get the right treatment to the right patients within the right therapeutic window.
- Contact us